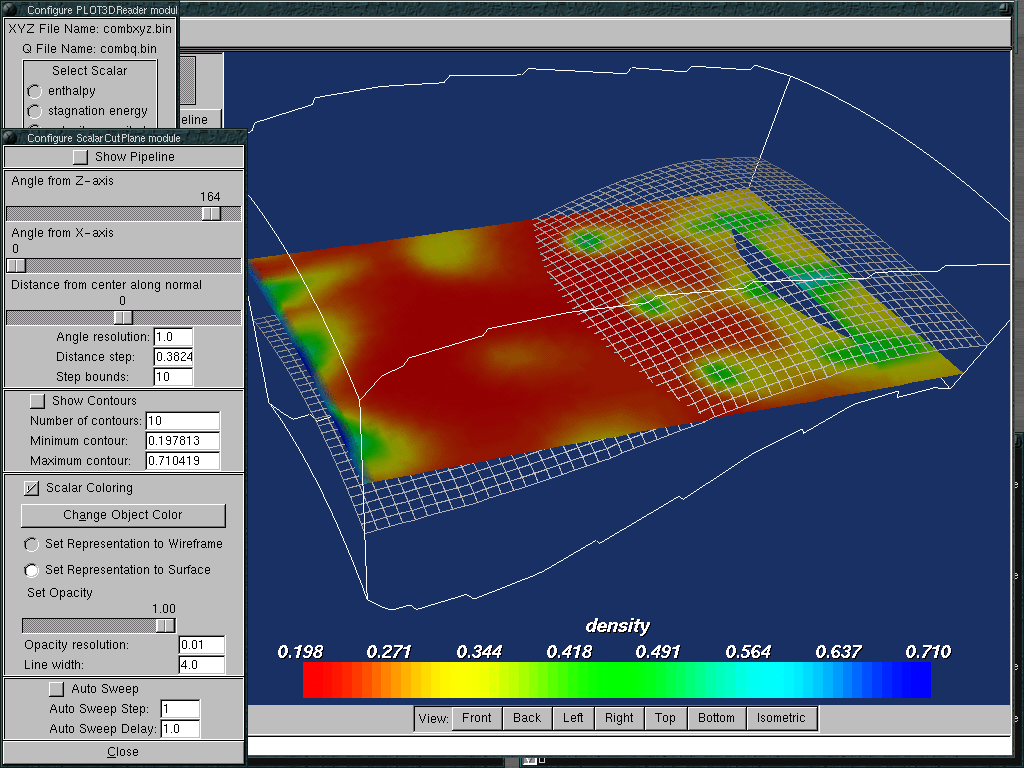
homepage: http://mayavi.sourceforge.net/index.html
- Visualize computational grids.
- Visualize scalar, vector and tensor data.
 ParaView
Homepage: http://www.paraview.org/New/index.html
ParaView is an open-source, multi-platform application designed to visualize data sets of size varying from small to very large. The goals of the ParaView project include the following:
- Develop an open-source, multi-platform visualization application.
- Support distributed computation models to process large data sets.
- Create an open, flexible, and intuitive user interface.
- Develop an extensible architecture based on open standards.
 OpenDX
Homepage: http://www.opendx.org/
OpenDX gives you new control over your data...and new insights into their meaning. Yet OpenDX is easy to use because it lets you visualize data in ways you've never dreamed of--without getting bogged down in the technology.
